Clinical characteristics of Gram-negative and Gram-positive bacterial infection in acute cholangitis: a retrospective observational study - BMC Infectious Diseases - BMC Infectious Diseases
Patient characteristics
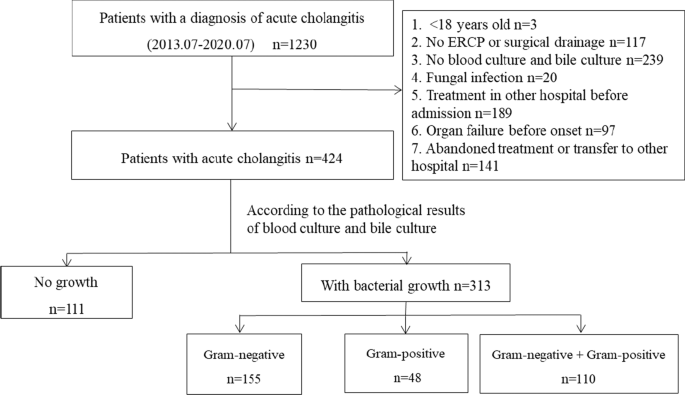
From July 2013 to July 2020, a total of 1230 patients were diagnosed with acute cholangitis in our hospital. After applying the eligibility criteria, 424 patients were eventually selected for the study (Fig. 1). According to the culture results, no bacterial growth developed in 111 patients (26.2%) while it developed in 313 patients (73.8%). Among the patients with bacterial growth, 155 patients had only Gram-negative bacteria cultured (49.5%), 48 patients had only Gram-positive bacteria cultured (15.3%), and 110 patients had both Gram-negative and Gram-positive bacteria cultured (35.1%). Comparing the baseline data of different culture results showed differences in gender, chronic renal insufficiency, cholecystectomy, biliary anastomosis, biliary tumors, recurrence, clinical symptoms of fever, and inappropriate antibiotic use. The baseline characteristics of patients with different culture results are summarized in Table 1.

Patient selection flowchart
Microbiology
Among the enrolled 424 patients, 266 (62.7%) patients had blood culture records, and 304 (71.7%) patients had bile culture records. The positive rate of blood culture and bile culture was 52.6% (140/266), 83.2% (253/304), respectively. A total of 135 strains of Gram-negative bacilli (77.1%) were detected in blood cultures and 209 strains of Gram-negative bacilli (58.7%) in bile cultures. Among the Gram-negative bacilli, Escherichia coli accounted for the highest proportion, with 45.7% prevalence in blood culture and 27.0% in bile culture, followed by Klebsiella pneumoniae, Enterobacter cloacae, and Pseudomonas aeruginosa. There were 40 cases of Gram-positive bacilli in blood culture (22.9%) and 147 strains (41.3%) in bile culture. Among the Gram-positive cocci, Enterococcus faecalis and Enterococcus faecium accounted for the highest proportion, followed by Enterococcus casseliflavus, Enterococcus gallinarum, and Streptococcus spp. The results of all cultures are summarized in Table 2.
The severity of illness of different cultures results
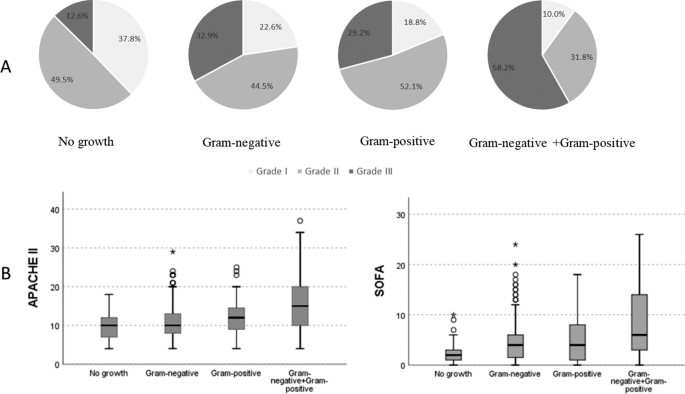
The proportion of Grade III patients (58.2%) in the mixed Gram-negative and positive group was significantly higher, and Grade I patients (10%) was lower than the other three groups (P < 0.001). Additionally, the proportion of Grade III patients (12.6%) in the No-growth group was significantly the lowest, and Grade I patients (37.8%) was higher. Comparison between groups showed no difference in severity distribution between the Gram-negative group and the Gram-positive group (Fig. 2A). Moreover, the APACHE II and SOFA scores of the mixed Gram-negative and positive group were higher than the other three groups (P < 0.001), with scores of 15.00 (10.00, 20.00) and 6.00 (3.00, 14.00), respectively. The No-growth group had the lowest scores, with 10.00 (7.00, 12.00) and 2.00 (1.00, 3.00), respectively. There was no difference between the Gram-negative group and the Gram-positive group (P = 0.661, P = 1.000) (Fig. 2B). The APACHE II and SOFA scores were 10.00 (8.00, 13.00) and 4.00 (1.00, 6.00) in the Gram-negative group, 12.00 (9.00, 14.75) and 4.00 (1.00, 8.00) in the Gram-positive group, respectively.

Differences in the severity of different culture results with acute cholangitis patients. A Using chi-square test to compare the severity of patients with different pathogen distributions (all P < 0.0001). P for trend of four groups, P < 0.0001. B Differences in APACHE II and SOFA scores of different pathogens. APACHE II: Acute Physiology and Chronic Health Evaluation II; SOFA: Sequential Organ Failure Assessment
Organ dysfunction and the outcomes of cholangitis with different culture results
The proportion of organ dysfunction in bacterial growth patients was significantly higher than that in the No-growth patients (P < 0.05) (Table 3). The septic shock rate, neurological dysfunction, hepatic dysfunction, and respiratory dysfunction in the mixed Gram-negative and positive group was higher than the Gram-negative group. However, there was no difference between the Gram-negative group and the Gram-positive group. Hematological dysfunction and renal dysfunction of the three groups were no different (P > 0.05). In logistic regression analysis models, the bacterial growth groups had an independent risk factor for organ dysfunction (Additional file 1: Table S1). The risks of an increased septic shock, neurological dysfunction, hepatic dysfunction, hematological dysfunction, and respiratory dysfunction in the mixed Gram-negative and positive group were compared to the Gram-negative group; the odds ratio and 95% CI (confidence interval) were 2.20 (1.20 to 4.04), 3.35 (1.65 to 6.81), 2.71 (1.28 to 5.74), 1.77 (1.01 to 3.09), 3.28 (1.68 to 6.42), respectively (Table 4). There was no difference between the Gram-negative group and the Gram-positive group in organ dysfunction risk (P > 0.05). The logistic regression analysis was adjusted for the following covariates: age, gender, biliary tumor, biliary stent, cardiovascular, malignancies, diabetes, and recurrence.
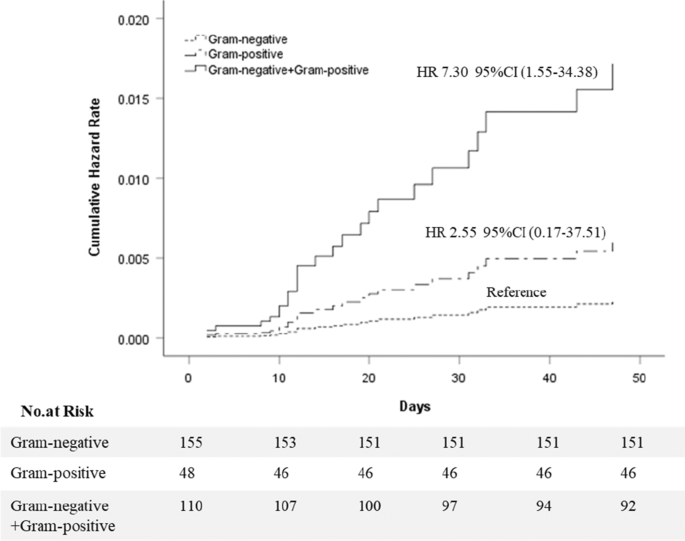
The intensive care unit admission day, hospital stay, and mortality rate of the bacterial growth groups were significantly higher than the No-growth patients, with 0.00 (0.00, 2.00) and 17.00 days (12.50, 24.00), respectively, and the mortality rate was 8.3% (26/313) (P < 0.001). There was no death in the No-growth group. The intensive care unit admission day, hospital stay, and mortality rate of the mixed Gram-negative and positive group were higher than the Gram-negative group, with 0.00 (0.00, 3.00) and 21.00 days (15.00, 26.00), respectively, and the mortality rate was 18.2% (20/110) (P < 0.05). However, there were no differences between the Gram-negative group and the Gram-positive group (Table 3). The Cox proportional-hazards regression model identified different culture results as independent risk factors for death (P = 0.031). An individual rate of mixed Gram-negative and positive group showed an increased hazard ratio of 7.30 (95% CI 1.55 to 34.38, P = 0.012) compared with the Gram-negative group. The rate of hazard ratio in the Gram-positive group and the Gram-negative group was no different (P = 0.495) (Fig. 3).

Cumulative hazard rates for death among different culture results that was the following categories: Gram-negative group, Gram-positive group, Gram-negative + Gram-positive group. 1. Cox proportional-hazards regression model were adjusted for age, gender, biliary tumor, biliary stones, biliary stent, recurrence, chronic liver disease, chronic renal insufficiency, cardiovascular, chronic-pulmonary, fever, white blood cell count, shock, neurological dysfunction, hepatic dysfunction, hematological dysfunction, renal dysfunction, respiratory dysfunction, inappropriate initial antimicrobial therapy. 2. CI: confidence interval. HR: hazard rate

Comments
Post a Comment